Tracking the Ethereum Network's Growth - The Daily Gwei #20
Using on-chain indicators to track Ethereum's growth.

I’ve spoken about the Ethereum networks growth a lot on Twitter lately and have provided some insights in previous editions of The Daily Gwei. Today, I wanted to highlight 3 of the key metrics that I’ve been keeping my eye on lately and why I think that they’re important indicators for measuring overall growth of Ethereum. Let’s start with what I consider the most important - fees paid on the Ethereum network.
Note that the big spike in the chart below is from the very high fees that were paid in 2 separate transactions a few weeks ago.

It’s no secret that fees have been really high on Ethereum for months now and, on average, the standard transaction fee is definitely getting more expensive as the weeks go by. This is leading to poor user experiences and is essentially “pricing out” both users and use-cases (for example, NFTs/crypto-gaming has suffered a lot lately). Though, it’s also pushing developers to deploy layer 2 scaling solutions faster and innovate in this space. I think that this would of happened eventually but it’s being accelerated now because necessity is indeed the mother of invention!
Other than pushing layer 2 innovation, the reason that I think fee growth is incredibly healthy for Ethereum is because it shows that there is real demand to use the network. Yes, a fair chunk of the fees are coming from scams/ponzis but if we exclude those (and exclude the one-off $2.6mil fees that are listed as number 2 and 3 below), then the rest of the usage is coming from Tether (USDT) and DeFi protocols.

Source: https://ethgasstation.info/
Tether (USDT) drives real economic activity both within DeFi protocols and between centralized exchanges/services and the explosive growth of decentralized exchanges over the last few months has pushed protocols like Uniswap, Kyber, IDEX, 1inch and Synthetix into the top 15 gas guzzlers over the last 30 days.
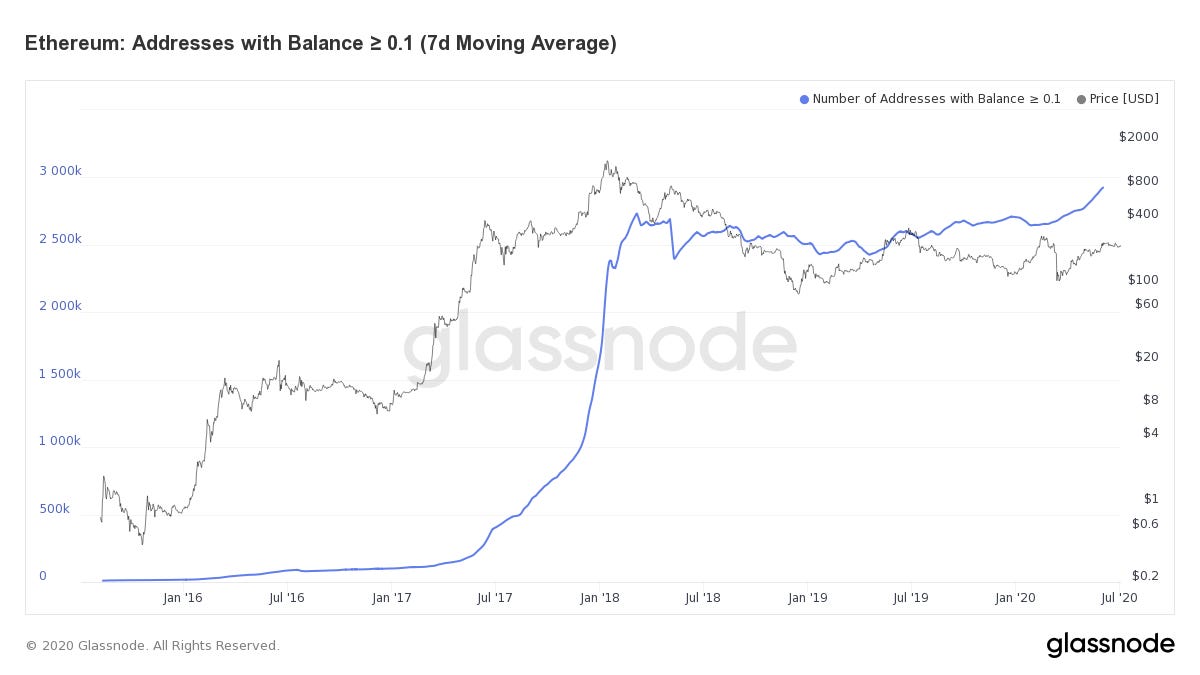
Another key metric that I keep a close eye on is Ethereum addresses with a balance greater than 0.1 ETH. The really interesting thing about this metric is that it had been in a sideways channel for almost exactly 2 years before breaking out upwards over the last few months.

Now, I can only speculate as to why this has happened but my working theory is that it’s because of the higher gas fees (and people doing more complex things on Ethereum). At time of writing, 0.1 ETH is about $28 and to be honest you need that amount and more to do just a few different things with DeFi apps today. For example, minting a Set on TokenSets can cost you up to $10 in gas fees alone because it is a complex transaction. Using a service like 1inch to get the best price for your favorite token can also cost anywhere from $5 to $10 in fees. Doing profitable yield farming is going to cost you $100’s in fees a week - the list goes on!
Lastly, another key metric that I like to check every now and then is the “Global In/Out of the Money” metric from IntoTheBlock. This basically shows how much of the ETH supply is currently sitting “in the money” aka in profit against USD.

Source: https://www.intotheblock.com/ (pro version)
At time of writing, 67% of the current ETH supply is in profit against USD with a large chunk of this ETH being in profit between $0 and $152.15 (as you can see from the big green bubble). I’ve long speculated about what story this metric actually tells from an investor point of view. Is it bullish because most of the supply is in profit meaning that they aren’t going to panic sell or is it bearish because as the price rises, these buyers will take profits? I’m of the opinion that its generally bullish because even though these ETH holders may take profits on the way up, it won’t be done in a way where everyone is trying to sell at once (like in a panic). Additionally, the buyers who are in a loss will either sell to “break even” or hold because they believe the price rise will continue. Though I believe that if the people holding ETH that was bought at $250 or above haven’t sold yet, then they will either wait to break even or are long-term investors.
There are other metrics that I tend to keep track of but these 3 are the key ones that I believe paint one of the best pictures for measuring both the growth/usage of the Ethereum network as well as measuring ETH investor/holder status and sentiment.
Have a great day everyone,
Anthony Sassano
If you’d like to support my on-going work to bring you a fresh Ethereum-packed newsletter every week day, feel free to make a donation on Gitcoin here (during the current matching round a 1 DAI donation is currently being matched on my grant by 36 DAI)!
All information presented above is for educational purposes only and should not be taken as investment advice.
Follow and Support Me
Donations (sassal.eth and my Gitcoin Grant)
EthHub (ethhub.eth)


