
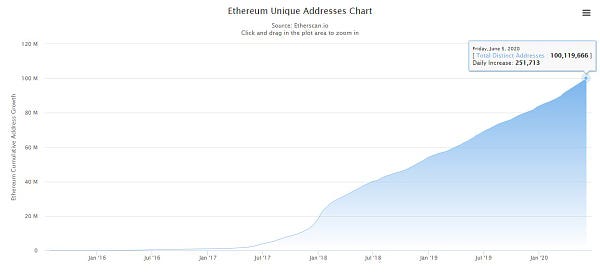
A couple of days ago, the Ethereum network created it’s 100 millionth unique address.
While this metric is nice from a vanity standpoint, just looking at the raw address count doesn’t really give us any tangible data to work with and misses out on all of the details.
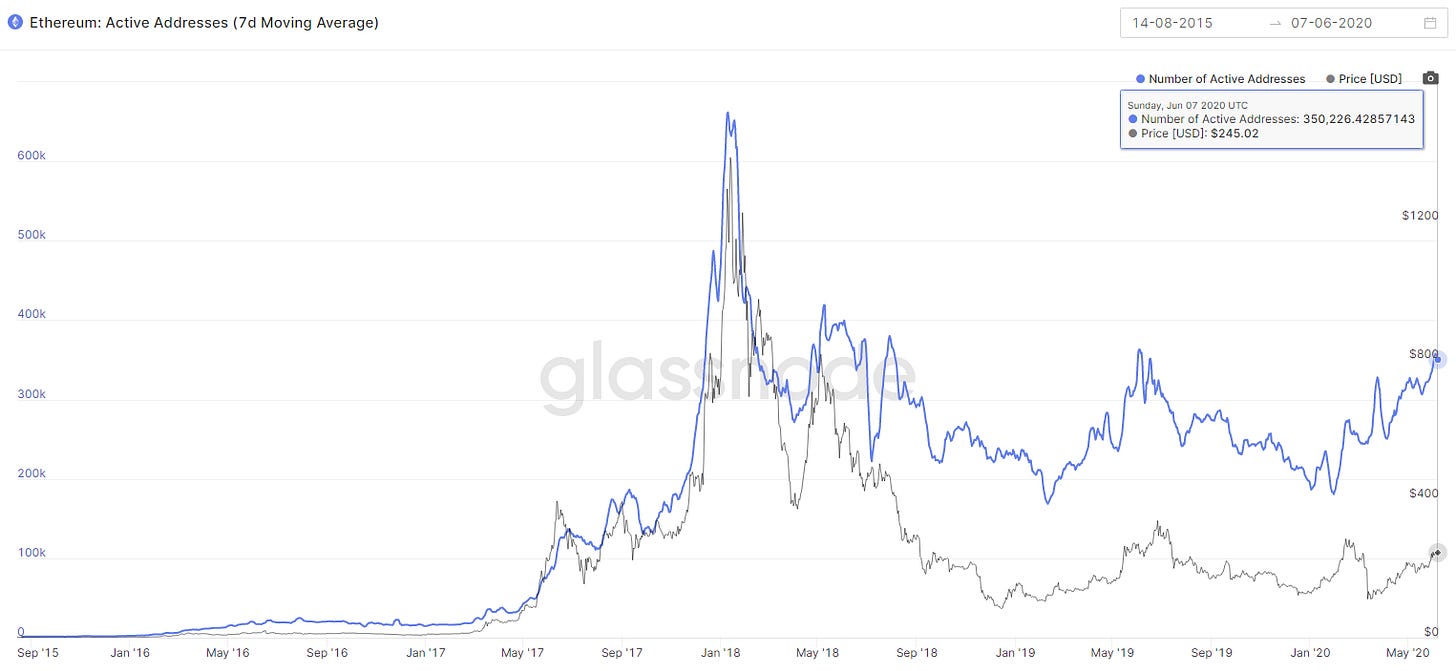
Active addresses is a much better measure here and, as you can see in the chart above, that has also been increasing steadily over the last few months and is currently at 350,000 (7d average). These active addresses count both new and existing addresses.
One of the most interesting charts that I’ve come across recently is something that Rafael and his team at Glassnode have put together.

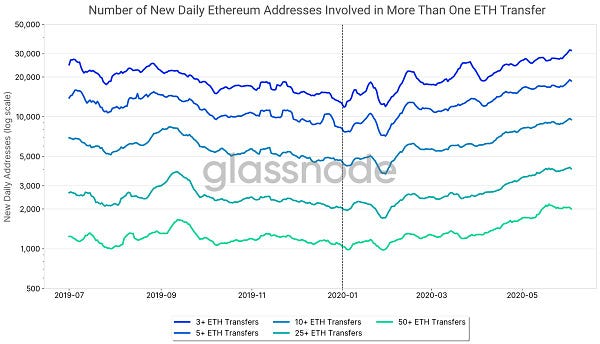
As you can see from the chart, the number of new addresses that are actually performing transactions has been growing steadily during 2020 after dropping off towards the end of 2019. What I like most about this chart is that it segments new addresses into buckets of how many transactions they’ve performed. If we wanted to use this data as a proxy for “daily new users” on the network then we could say that there are anywhere from 2,000 to 32,000 of those.
For the rest of this piece, I’m going to do some napkin math and make a lot of assumptions in order to get a rough picture of what all of these addresses are doing. The breakdown below is in no way substantive and I’ve definitely missed things. In saying that, I’m very interested to work with anyone who wants to continue this research based on hard data.
Okay, let’s break Rafael’s chart down further. Do we really think new addresses performing 25 - 50+ transactions a day are “organic” or are they more likely bots? More granular data is needed here but I’ll make a bet that many of these new addresses are bots. Bots aren’t inherently a bad thing but if our goal is to measure actual human users then we need to filter those out. On the other hand, we can’t ignore the elephant in the room that a lot of Ethereum’s block-space over the last few months has been taken up by massive ponzi schemes (and is a major reason for gas prices being so high).
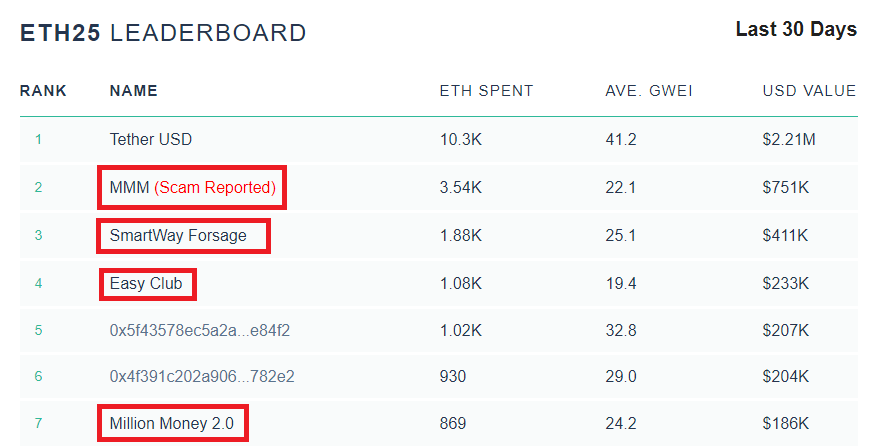
Let’s take a look at the most prominent ponzi/scam listed here - MMM (a ponzi scheme in the spirit of the original MMM that stretches all the way back to the 1990’s). Looking directly at the contract itself, it has been part of almost 2 million transactions since it was deployed about 290 days ago. Each of these transactions can be traced back to a proxy address (that takes in funds and then forwards to the MMM contract) and then traced back even further to the actual accounts of the people participating.
Quickly looking through Etherscan myself, I can see that the process of a user receiving ETH/tokens, sending it to the proxy, then the proxy forwarding it to the MMM contract counts for at minimum 3 transactions and that’s where a decent chunk of that 32,000 seems to be coming from. I’m going to assume that these new users are making, on average, more than 3 transactions (they need to get the ETH/tokens into their address first) so I’ll set the upper bound here at 10.
Alright so based on those assumptions, let’s take an educated guess that a new DeFi user would probably perform anywhere from 10 to 25 transactions on their first day. Now, let’s put this in context.
A new user flow using Coinbase and MetaMask might look like this:
Buy ETH on Coinbase
Create new address on MetaMask
Withdraw ETH to MetaMask as a test (1 tx)
Withdraw remaining ETH to MetaMask (1 tx)
Open a Vault on MakerDAO using ETH (1 tx)
Generate DAI (1 tx to generate, 1 tx to send DAI back to your account)
Deposit DAI into Compound (1 tx to approve DAI, 1 tx for deposit)
Get cDAI back from Compound (1 tx)
Move cDAI to another address (hardware wallet?) as test (1 tx)
Move rest of cDAI to other address (1 tx)
This totals 10 transactions for a Coinbase > Maker > Compound > Hardware Wallet user flow. It’s good to remember that every new Ethereum address needs to approve tokens/interactions for every single contract that they interact with (and pay the gas fee in ETH!) so our original estimate of 10 to 25 transactions for new users each day actually makes sense. This gives us a total of 9,000 new and active Ethereum addresses each day (based on Rafael’s chart showing 10+ txs a day).
Now to break this number down again based on another piece of data - total DeFi users over time (as measured by DeFi app interactions).

This chart measures cumulative users (addresses) that have interacted with the most popular DeFi protocols (Maker, Synthetix, Compound, Uniswap, dYdX, Augur, Aave, InstaDApp, Kyber, 0x, bZx, PoolTogether, Balancer, Set Protocol, Opyn, CurveFi, OpenSea, Nexus Mutual, and 1inch) and it excludes Dai/Stablecoin transfers. Over the last few months, this number has been increasing by roughly 500 to 1000 a day - a far cry from the 9,000 number we get above. In saying that, this chart above misses all of the other non-DeFi transactions (and untracked DeFi protocols). In my example above, the only transactions that would of counted as a “DeFi transaction” were the interactions with Compound and MakerDAO (and only counted once per address)!
I wanted to also make a note on stablecoin transfers as they count for a large number of transactions on Ethereum. USDT is, by far, the most used stablecoin on Ethereum and we can assume that most if not all of this activity is basically arbitrage trading between exchanges (which would put USDT into the 25+ transactions a day category). Though, I’m unsure if these arbitrage bots would be creating new addresses that perform 25+ txs a day. Regardless, we can exclude most stablecoin activity from this breakdown of users. Metrics for all stablecoins can be found here for those curious.
Okay, this piece is getting way too long, let’s wrap up. Based on all the data I presented above (along with many assumptions), we can assume that there are 500 to 1000 new DeFi users a day and a further 8,000 new addresses that are either the same users creating another address or users that are dabbling in stablecoins, trading tokens on exchanges (centralized or otherwise), or interacting with DeFi protocols that the chart above does not track.
This number is really low, right? Even taking the upper bound number of 1,000 new DeFi users a day, it still means a mere 365,000 new DeFi users a year. For context, Facebook reached ~100 million users in 2008 (4 years after launch) which would average out to ~68,000 new users per day or ~25 million per year.
As you can see from the data, we’re still very early in Ethereum’s adoption cycle. In saying that, I don’t believe that on-chain activity is the only (or even best) way to measure growth or use of DeFi/dapps - I wrote about why here.
I’m constantly looking for ways to accurately measure organic human activity on the Ethereum network (aka people actually pushing the buttons themselves). I’ve made a lot of assumptions in this piece and there are definitely holes in my methodology but I think it’s something that can be iterated and improved upon. If you want to take this content and do a more in-depth study - please feel free to!
Have a great day everyone!


Nice work @sassal, good sleuthing too