Feeling Gassy - The Daily Gwei #86
Ethereum ate a bit too much food over the last few months and has been paying the consequences.

Final reminder: there is only ~24 hours left of the current Gitcoin Grants matching round so don’t forget to donate to your favorite projects here. If you’d like to support my on-going work to bring you a fresh Ethereum-packed newsletter every week day, feel free to make a donation to my Gitcoin Grant here.
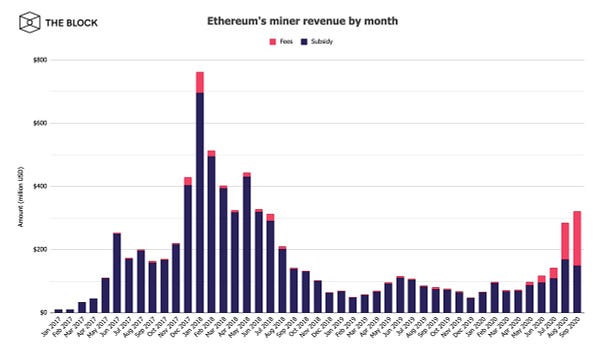
We all know that the last few months on Ethereum have been the most insane for gas fees in its entire history. We kicked off yield farming season with the launch of COMP in June and then had “food ponzi” mania take over the crypto space for a while. During this, we also had a mini DeFi token bull market which saw DEX volumes explode across the board and then finally it seems that the mania came to an end a few days after the UNI token launch.


Larry’s chart above visualizes the insanity that was the last 2 months in Ethereum quite nicely as it shows how much money miners made from fees vs the block subsidy (aka block rewards). As you can see on the chart, total fees for August and September were much higher than even what we saw back in the peak of the 2017 bull market. You may be wondering, how is that possible given that there are less people in crypto now than there were back then?
Well it comes down to the way transactions work on Ethereum. I’ve explained this in previous newsletter editions before but for those that are unfamiliar Ethereum has a system called “gas” which dictates how fees work within the entire protocol. Basically, each type of transaction on Ethereum will have a different amount of gas that it consumes - the more complex a transaction is, the more gas it will consume. For example, sending ETH is relatively cheap and only requires 21,000 gas to execute whereas depositing funds into a lending protocol will require much more gas and thus it is more resource intensive and expensive.
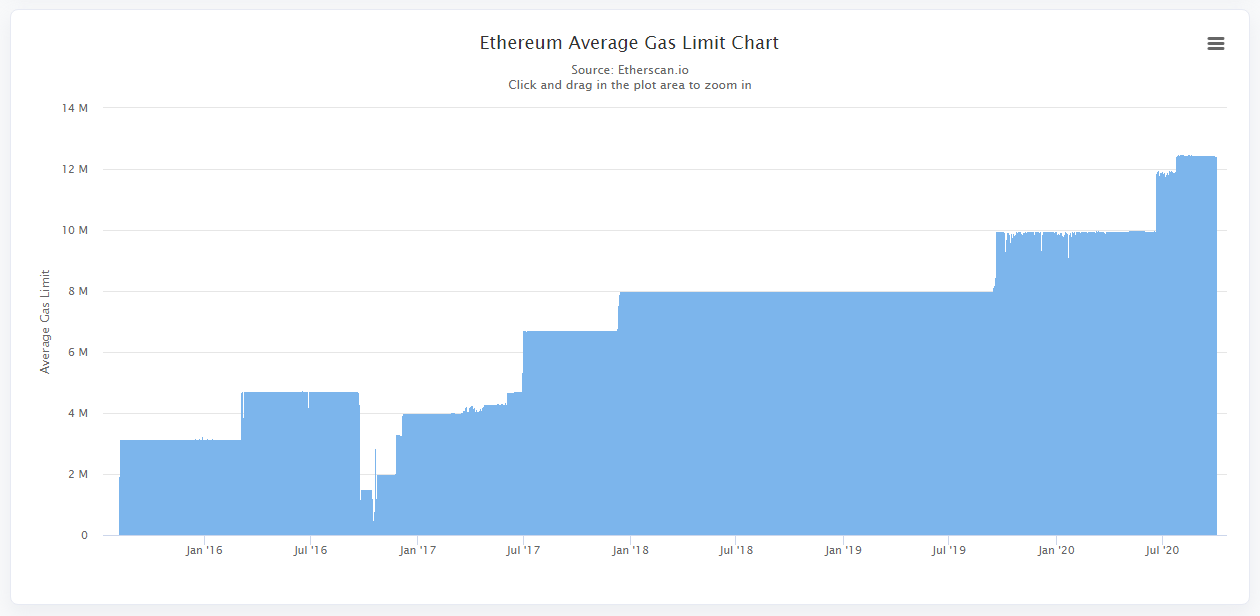
The reason why we saw such a large spike over the last 2 months is because most of the traffic on the network was “complex traffic” - DEX trading, lending/borrowing, yield farming, flash loans, gas token creation and much more. This sort of activity didn’t really exist in 2017 because these apps and use-cases weren’t live so most of the activity on the network had to do with ICOs which were much less resource intensive. It’s also worth noting that the block subsidy was higher in 2017 and 2018 than it is today (see this chart) and of course the price of ETH was higher in 2017. The network gas limit was also much lower than it is today which means Ethereum blocks fit less transactions in them than they do today.

Source: https://etherscan.io/chart/gaslimit
This is the reason that scaling technology is so critical for Ethereum - we are never going back to a “basic transaction” world - there will continue to be more and more complex apps deployed to layer 1 so we need to off-load this activity to layer 2 or high gas prices will keep pricing out users. You may be wondering, can’t we just keep increasing the gas limit and thus increase the capacity of the chain? Well, in theory, yes - but this is not an ideal solution for the reasons I outlined in this post.
Finally, a piece about gas wouldn’t be complete without mentioning EIP-1559. A fun little statistic that was shared during the last 2 months was that if EIP-1559 was implemented, the ETH supply would’ve been net negative for many of the high gas fee days - it was negative 30,398 ETH on September 18th! This is because most of the fee revenue would’ve been burnt instead of paid to miners. If we take a look at the cumulative ETH that would’ve been burnt since September 2019, it comes to ~970,000 which is ~0.85% of the current ETH supply. Pretty neat, huh?
Have a great day everyone,
Anthony Sassano
All information presented above is for educational purposes only and should not be taken as investment advice.


